Tracing fields, tracing commodities
Trazo creates field boundaries across South America from satellite imagery, revealing how agricultural landscapes are changing over time.
Trazo is the Spanish word for brushstroke, from the verb trazar; to trace, to draw, and to plot. By tracing fields by hand in satellite imagery, we can choose the most powerful field training data for creating robust, generalizable field boundary detection models. Each sketched field in our dataset adds knowledge about the wide diversity of agricultural systems in South America. These sketches teach models the culture of agriculture and how landscapes differ.
Trazo echoes the English word “trace”: to follow a path, uncover origins and make hidden connections legible. Trazo is both about creating powerful, diverse training data and the aim of tracing commodities through the supply chain, so that agriculture can be monitored for deforestation.
Trazo is a suite of tools for field boundary segmentation, initially developed for South America’s rich landscapes. It includes a diverse training dataset, test sets, four model checkpoints, and an inference pipeline for delineating agricultural field boundaries across South America.
The first release includes 10,935,129 field boundaries and extends Fields of The World. Read more about Trazo in our publication, “Field Boundaries of South America” (Grupp et al. 2026).






Coverage
The original benchmark included 1,854 field boundaries in South America. Trazo adds 46,908.
46,908 expert annotated fields
The Fields of The World benchmark included 1,854 field boundaries in South America, about 0.11% of its global corpus, drawn from a single site in Bahia, Brazil. Trazo extends that coverage to 17 soy-producing ecoregions, including Araucaria, Uruguayan Savannah, the Chiquitania, the Pampas, Amazonian moist forests, the Chaco, and the Cerrado.
Models
Trazo provides four model checkpoints, each trained on a different combination of South American Data and FTW Data for different use cases. The right checkpoint depends on the region, the agricultural system, and the specific accuracy metric.
Best for large, uniform row-crop systems and boundary sensitive tasks where subtle soft boundaries matter.
Tuned for South American agricultural systems, with strong pixel and object precision.
A well-tested and qualitatively evaluated checkpoint, combining global FTW coverage with the 17-ecoregion regional data.
Tuned for Mato Grosso and complex landscapes, with strong object-level recall. Works with median() composite imagery.
Trazo3 is the recommended model for most use-cases. It was trained on
median composited imagery, samples from Mato Grosso
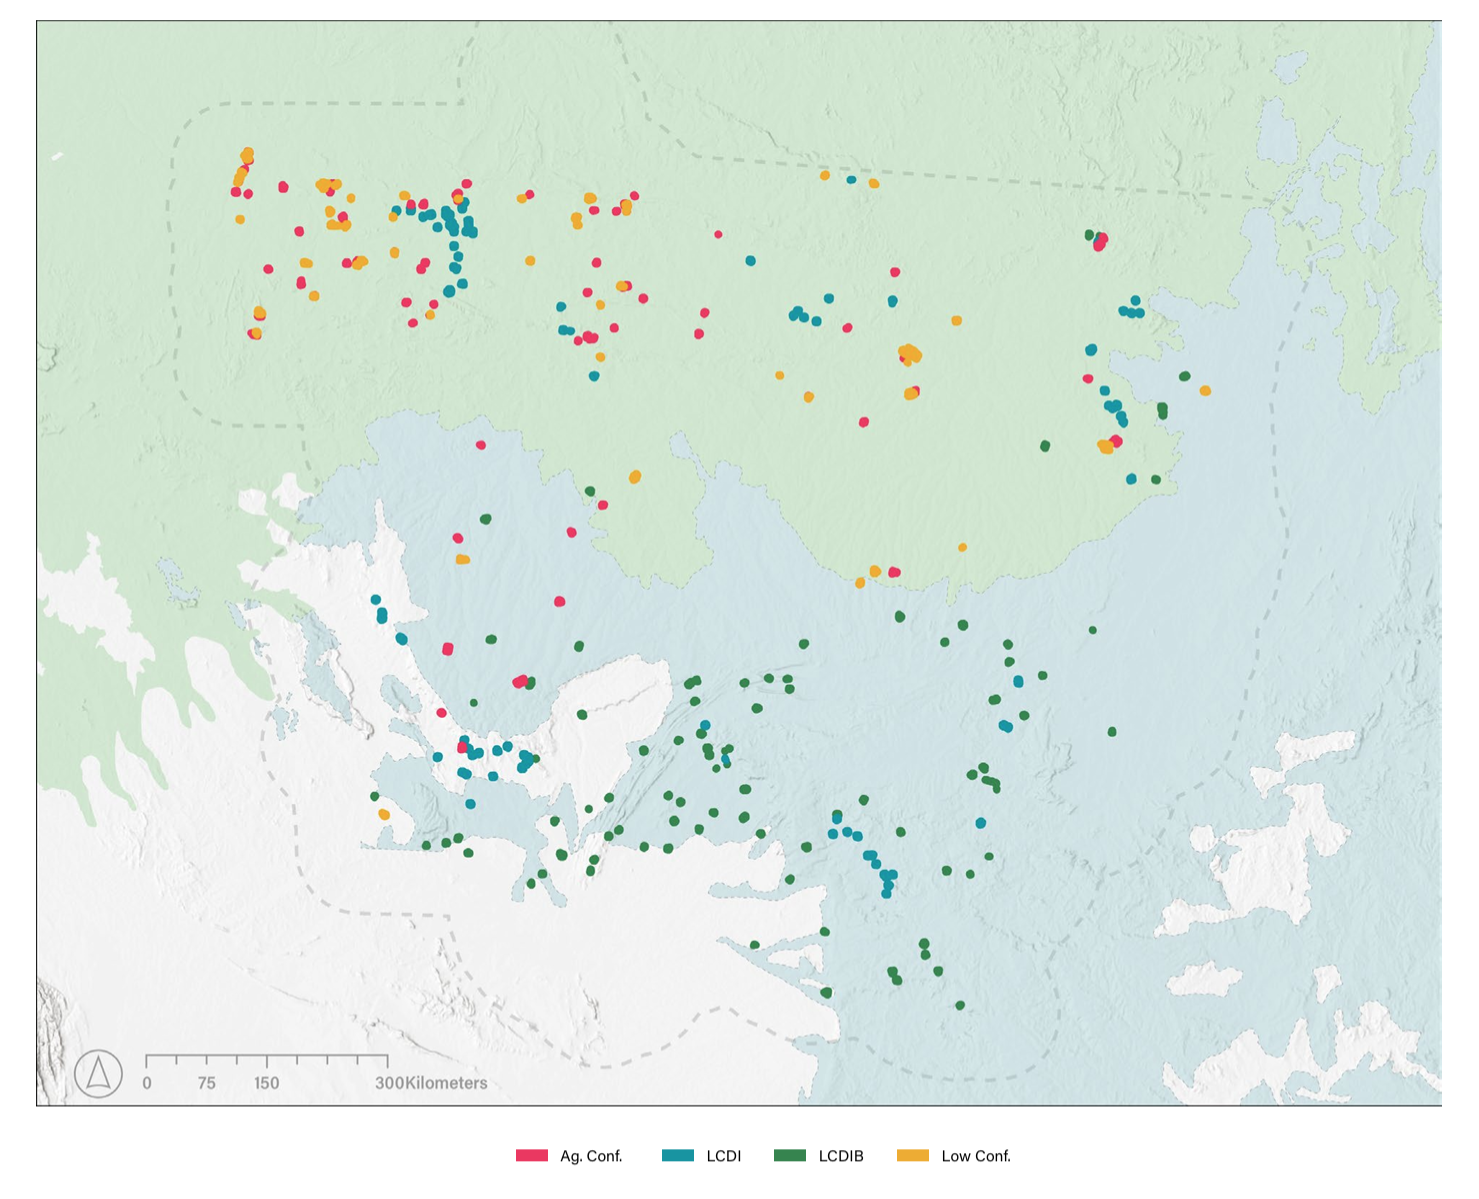 This is a map of the 400 active learning samples in Mato Grosso which were part of Trazo3’s training corpus. All can be found on Source Cooperative under the training folders “matogrosso_brazil_STRATEGY” where strategy is the active learning query method. Blue on the map is the Cerrado ecoregion and green is the Amazon biome.
which spans the Amazon and Cerrado, and encodes burn scars
This is a map of the 400 active learning samples in Mato Grosso which were part of Trazo3’s training corpus. All can be found on Source Cooperative under the training folders “matogrosso_brazil_STRATEGY” where strategy is the active learning query method. Blue on the map is the Cerrado ecoregion and green is the Amazon biome.
which spans the Amazon and Cerrado, and encodes burn scars
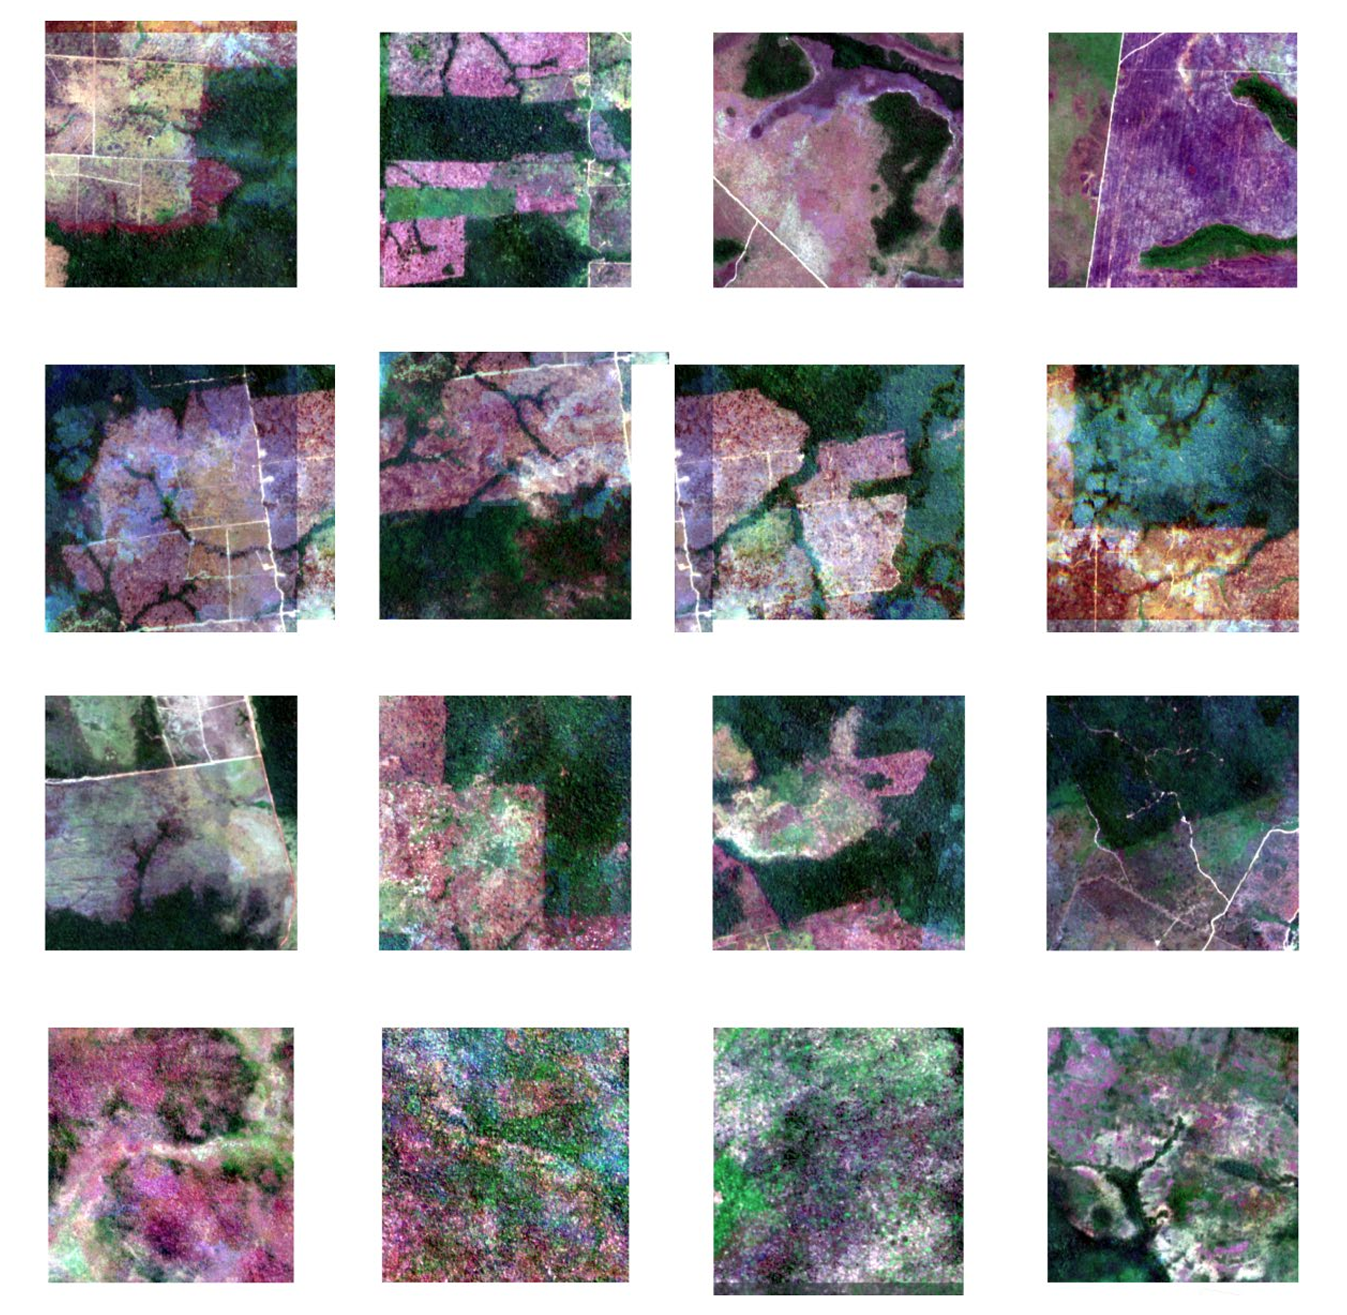 Most of the 100 lowest-confidence samples contain burn scars (> 60%, determined by visual inspection). Row 1 shows examples of burn scars from intentional agricultural burning. Row 2 shows examples of burn scars from intentional agricultural burning and haze from clouds and fires. Row 3 shows examples of recently burned fields that exhibited some form of vegetation recovery or recent planting. Rows 1–3 show active signs of management. Fields were annotated where anthropogenic management was clear. Row 4 shows burn scars on forests that show no clear management pattern; these chips were not annotated. Trazo3, trained on these samples, encodes knowledge of agricultural field burning.
and other features from active learning sampling.
Most of the 100 lowest-confidence samples contain burn scars (> 60%, determined by visual inspection). Row 1 shows examples of burn scars from intentional agricultural burning. Row 2 shows examples of burn scars from intentional agricultural burning and haze from clouds and fires. Row 3 shows examples of recently burned fields that exhibited some form of vegetation recovery or recent planting. Rows 1–3 show active signs of management. Fields were annotated where anthropogenic management was clear. Row 4 shows burn scars on forests that show no clear management pattern; these chips were not annotated. Trazo3, trained on these samples, encodes knowledge of agricultural field burning.
and other features from active learning sampling.
Trazo3 was tested against plots of land delineated by South American
farmers and landowners. Against farmer-delineated boundaries, Trazo3 had
84% IoU accuracy for corn and 75% accuracy for soybean. Hover for the
worst matches
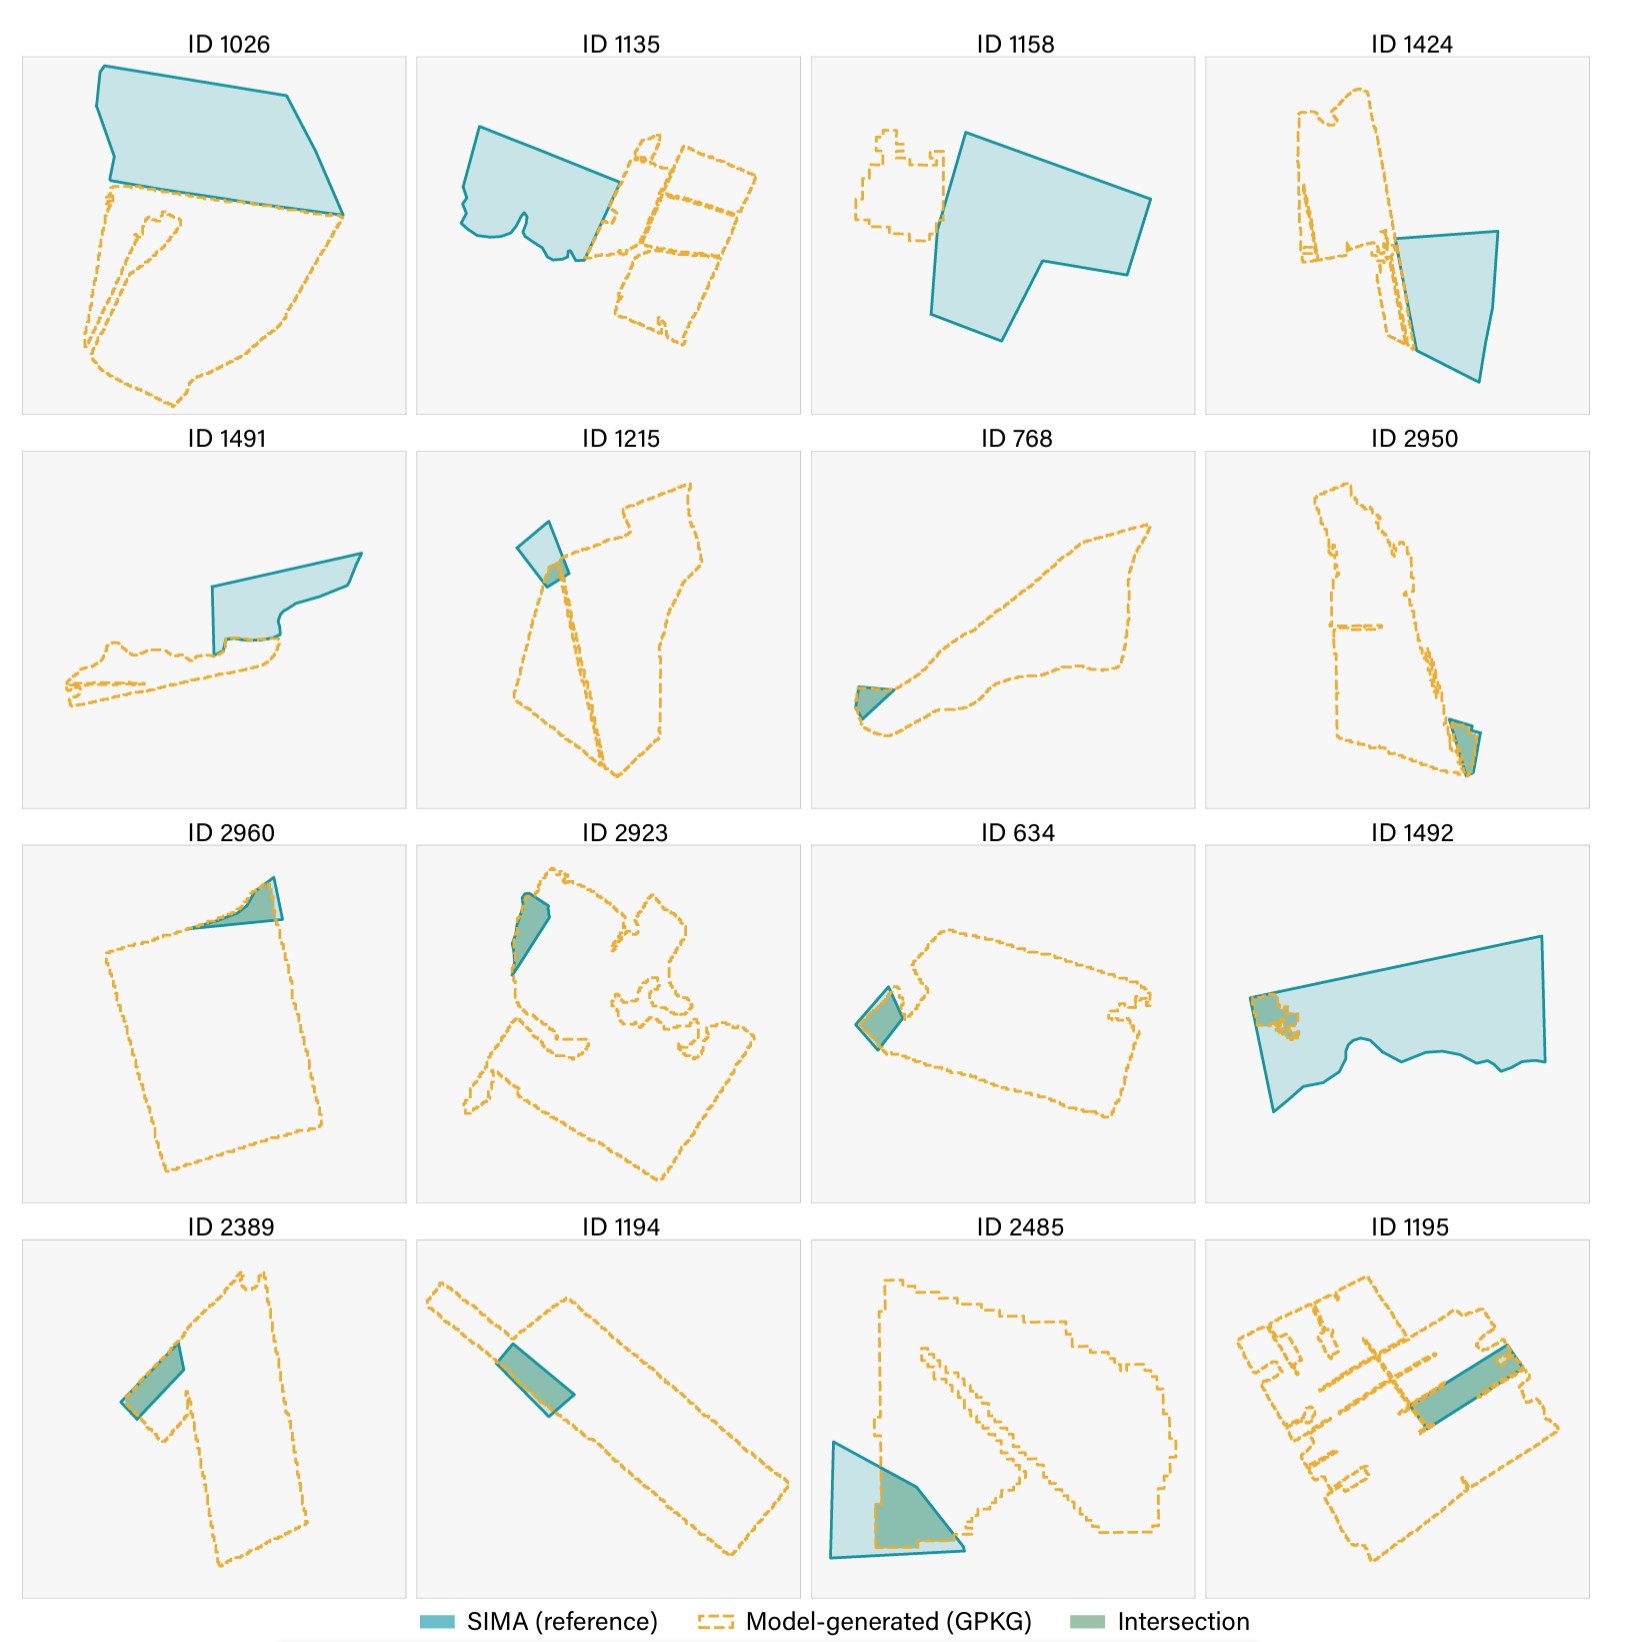 In the lowest 16 matches by IoU, the majority of Trazo3 fields are larger than the SIMA polygons, indicating possible overmerging of fields and missed boundaries, but correctly identified agriculture extent. ID 1195 illustrates overmerging: the boundaries are partially completed, creating one very large field boundary object. This may also indicate that there is a bias between small, standalone farmer polygons. It is possible that larger fields coincident with the model field result would have produced a better match than with the standalone small SIMA field match.
, the
median matches
In the lowest 16 matches by IoU, the majority of Trazo3 fields are larger than the SIMA polygons, indicating possible overmerging of fields and missed boundaries, but correctly identified agriculture extent. ID 1195 illustrates overmerging: the boundaries are partially completed, creating one very large field boundary object. This may also indicate that there is a bias between small, standalone farmer polygons. It is possible that larger fields coincident with the model field result would have produced a better match than with the standalone small SIMA field match.
, the
median matches
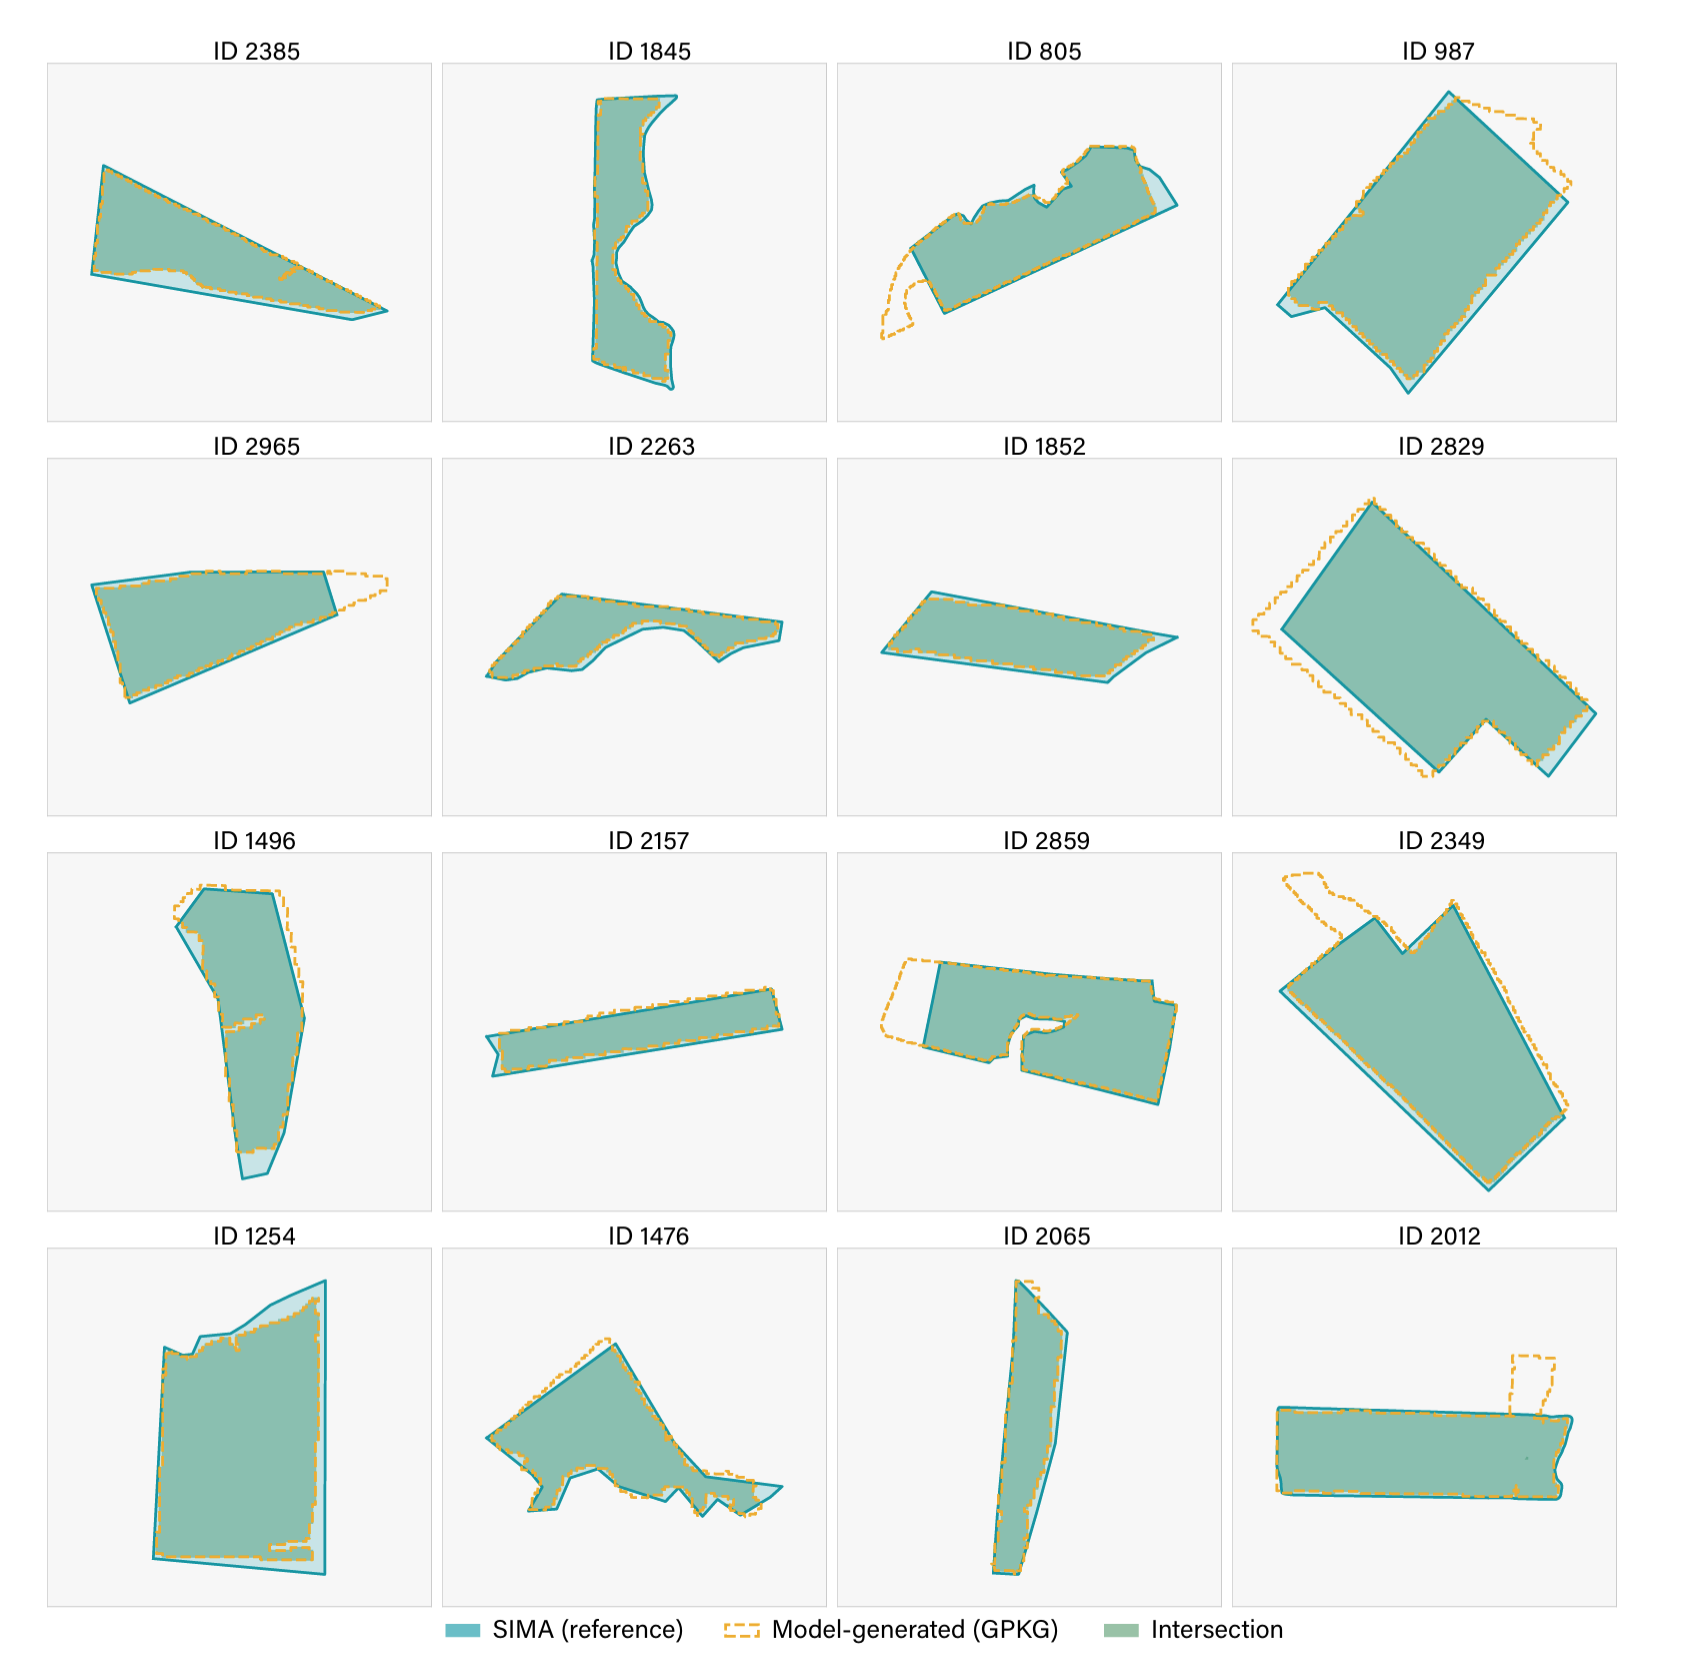 The median-matched polygons show slightly greater discrepancy compared to the 16 best polygons. The most common error is a larger predicted area by Trazo3, seen in the yellow dotted lines extending outside of the shared, green extent.
, and the
best matches
The median-matched polygons show slightly greater discrepancy compared to the 16 best polygons. The most common error is a larger predicted area by Trazo3, seen in the yellow dotted lines extending outside of the shared, green extent.
, and the
best matches
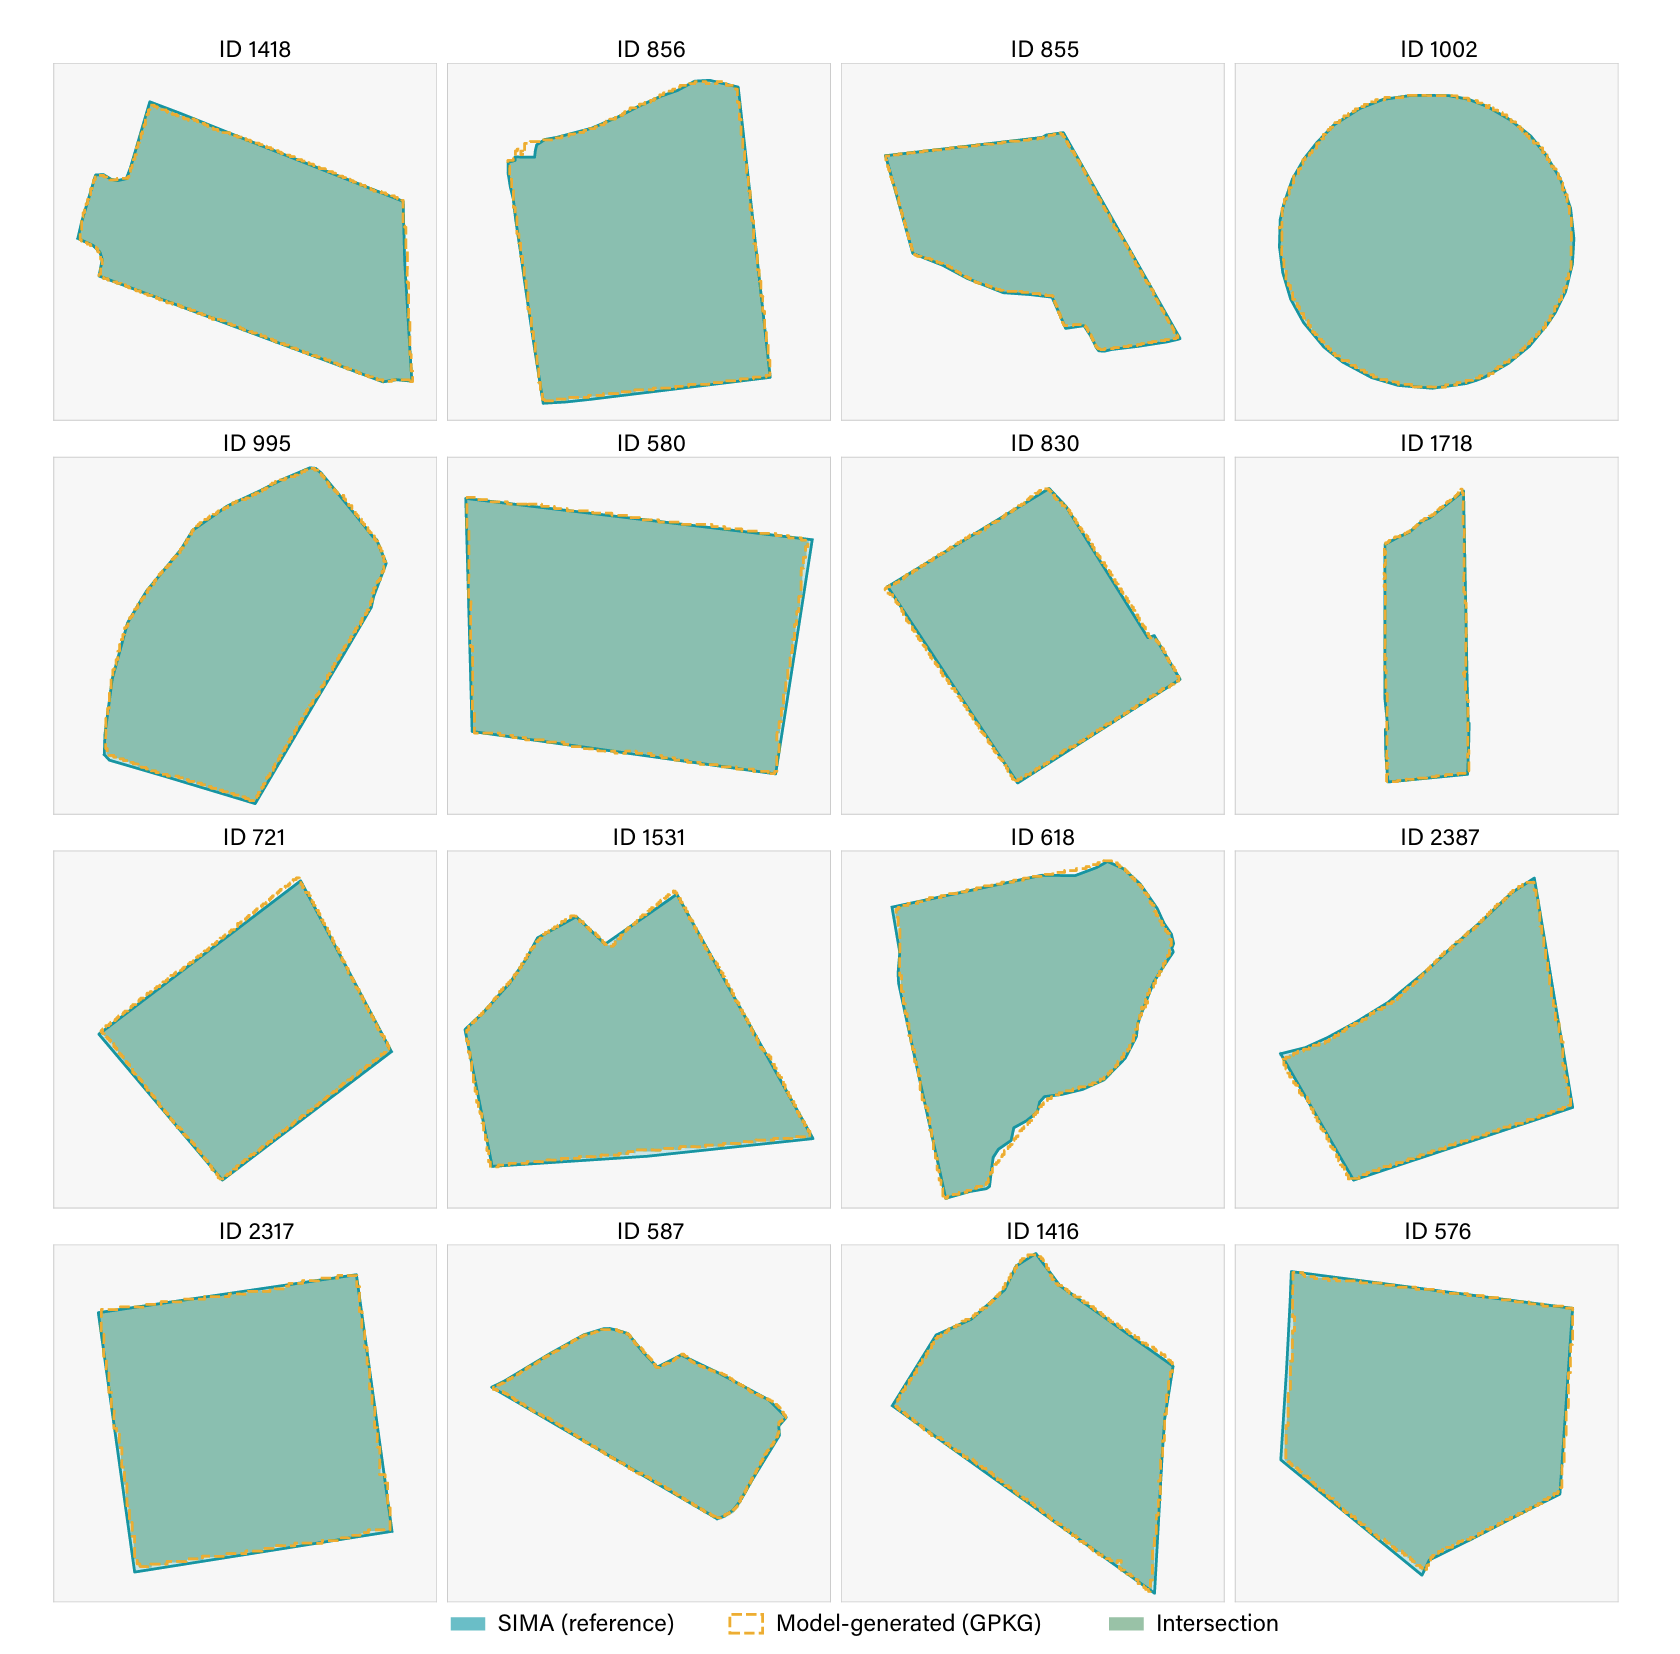 The best matches and median matches (best displayed here) are not too different. This strong performance is reflected in high IOU scores across all polygon matches, 84% IoU accuracy for corn and 75% accuracy for soybean.
. The farmer in-situ-informed ground-truth polygons help show that
Trazo3-derived boundaries are sufficiently accurate for supply-chain
traceability applications in the commercial annual crop-producing
landscape. This test set reveals strong Trazo3 model performance against
farmers’ and landowners’ conceptualization of the definition
of a plot of agriculture.
The best matches and median matches (best displayed here) are not too different. This strong performance is reflected in high IOU scores across all polygon matches, 84% IoU accuracy for corn and 75% accuracy for soybean.
. The farmer in-situ-informed ground-truth polygons help show that
Trazo3-derived boundaries are sufficiently accurate for supply-chain
traceability applications in the commercial annual crop-producing
landscape. This test set reveals strong Trazo3 model performance against
farmers’ and landowners’ conceptualization of the definition
of a plot of agriculture.
All Trazo models are trained on South American data, much of which was
intentionally sampled on the frontier of nature and agriculture. The
training data captures diverse agroecological contexts and hotspots of conversion.
These models are inclusive of all actively managed agricultural plots
and were optimized for annual crops. To be sure they are inclusive of
recently converted fields, their training data includes field
annotations of recent conversion
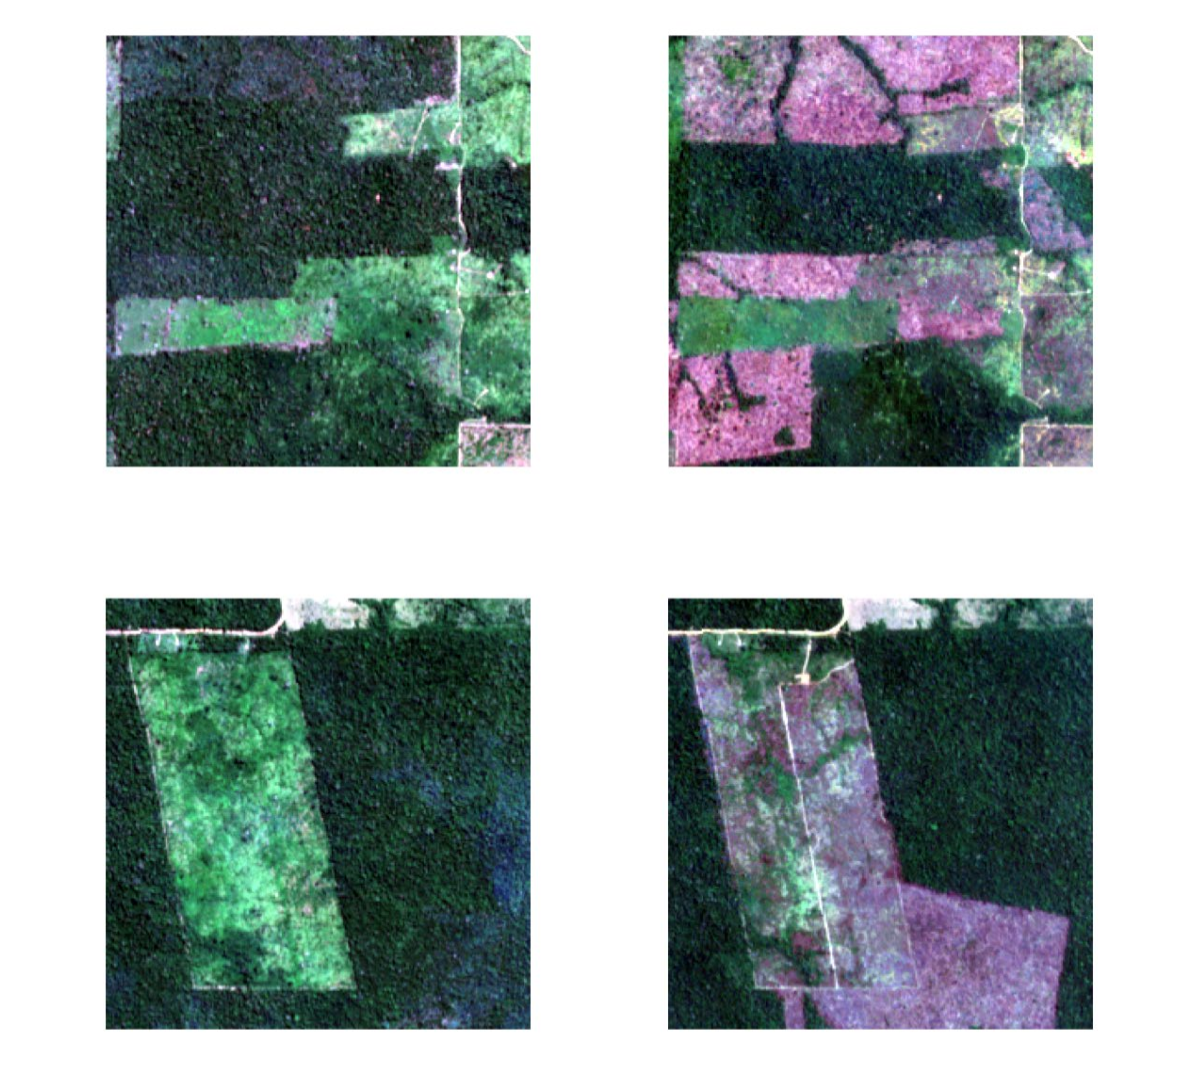 On the left-hand side during the planting season, there was more intact forest. In the harvest season, new land was opened up in the forest through clearing. We annotate newly cleared land which fit our definition of clear signs of recent management and anthropogenic intervention.
that occurred between the planting and harvest seasons.
On the left-hand side during the planting season, there was more intact forest. In the harvest season, new land was opened up in the forest through clearing. We annotate newly cleared land which fit our definition of clear signs of recent management and anthropogenic intervention.
that occurred between the planting and harvest seasons.
Pipeline
A sequence of composable utilities for moving from raw imagery to field-boundary predictions. The full reference is in the repository README.
Create data
AOI grids and 4-band Sentinel-2 chips at planting and harvest windows.
Prepare data
Pair temporal stacks, normalize, build instance and semantic masks.
Sample & fine-tune
Active learning, temporal diversity, geographic balancing.
Train
U-Net, UperNet, DeepLabV3+, FCSiam, with twelve loss functions.
Infer at scale
Select the best Sentinel-2 scenes per tile and run multi-checkpoint inference at scale.
Use
Trazo includes five open artifacts under CC-BY-4.0; the methodology, the training dataset, models trained from that data, code to scale the model, and the field boundary release.
Citation
Cite both the Trazo technical note (Grupp et al. 2026) and the original Fields of The World benchmark (Kerner et al. 2025).